In this example, we show brief usage of scIHDB tools for dataset single-cell exploration.
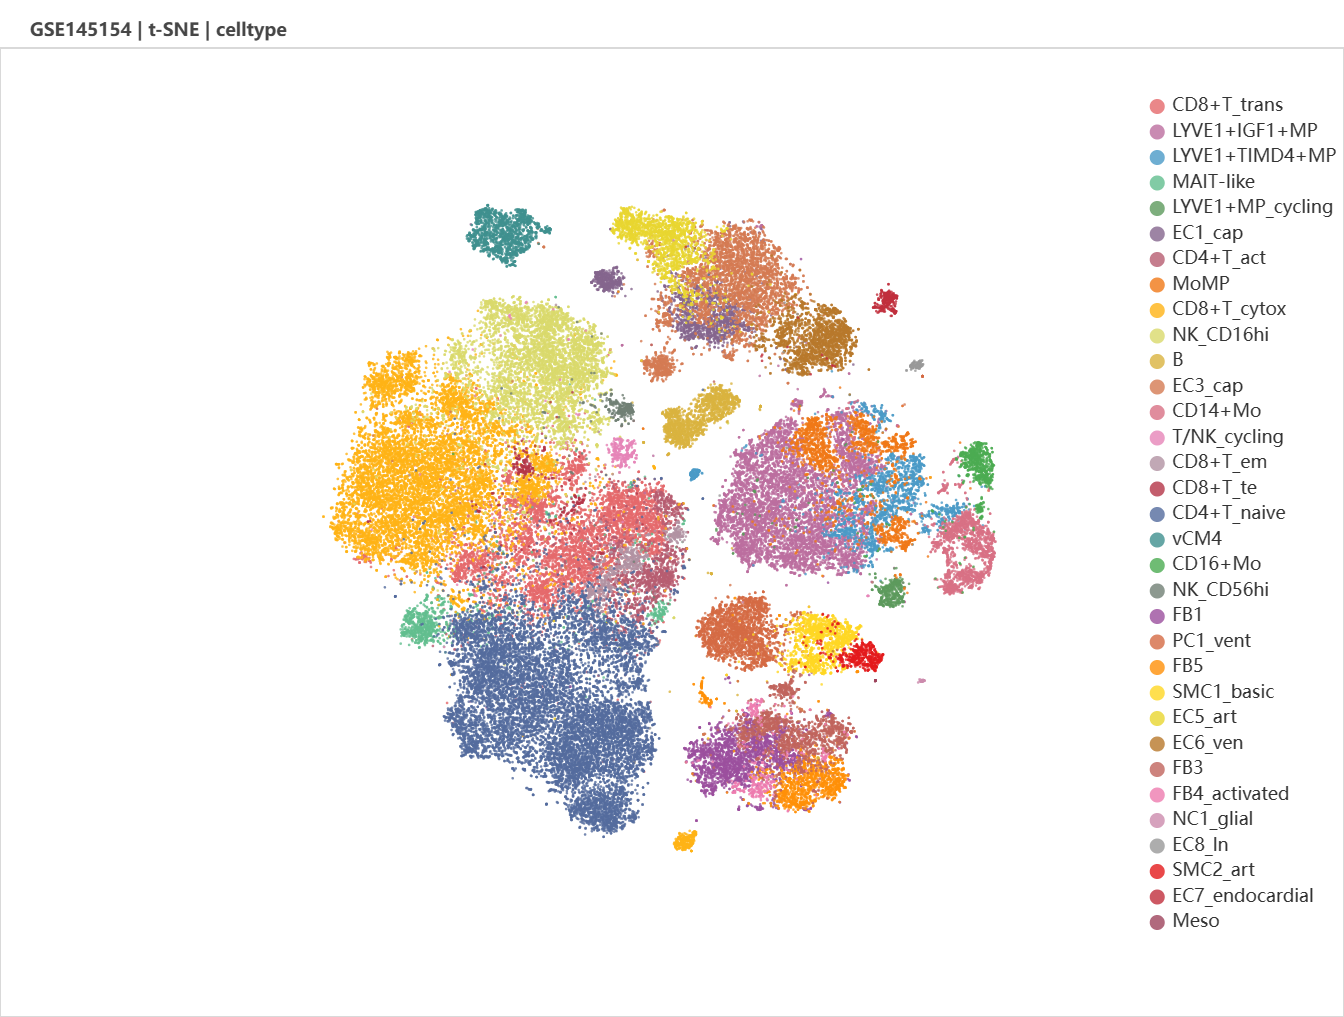
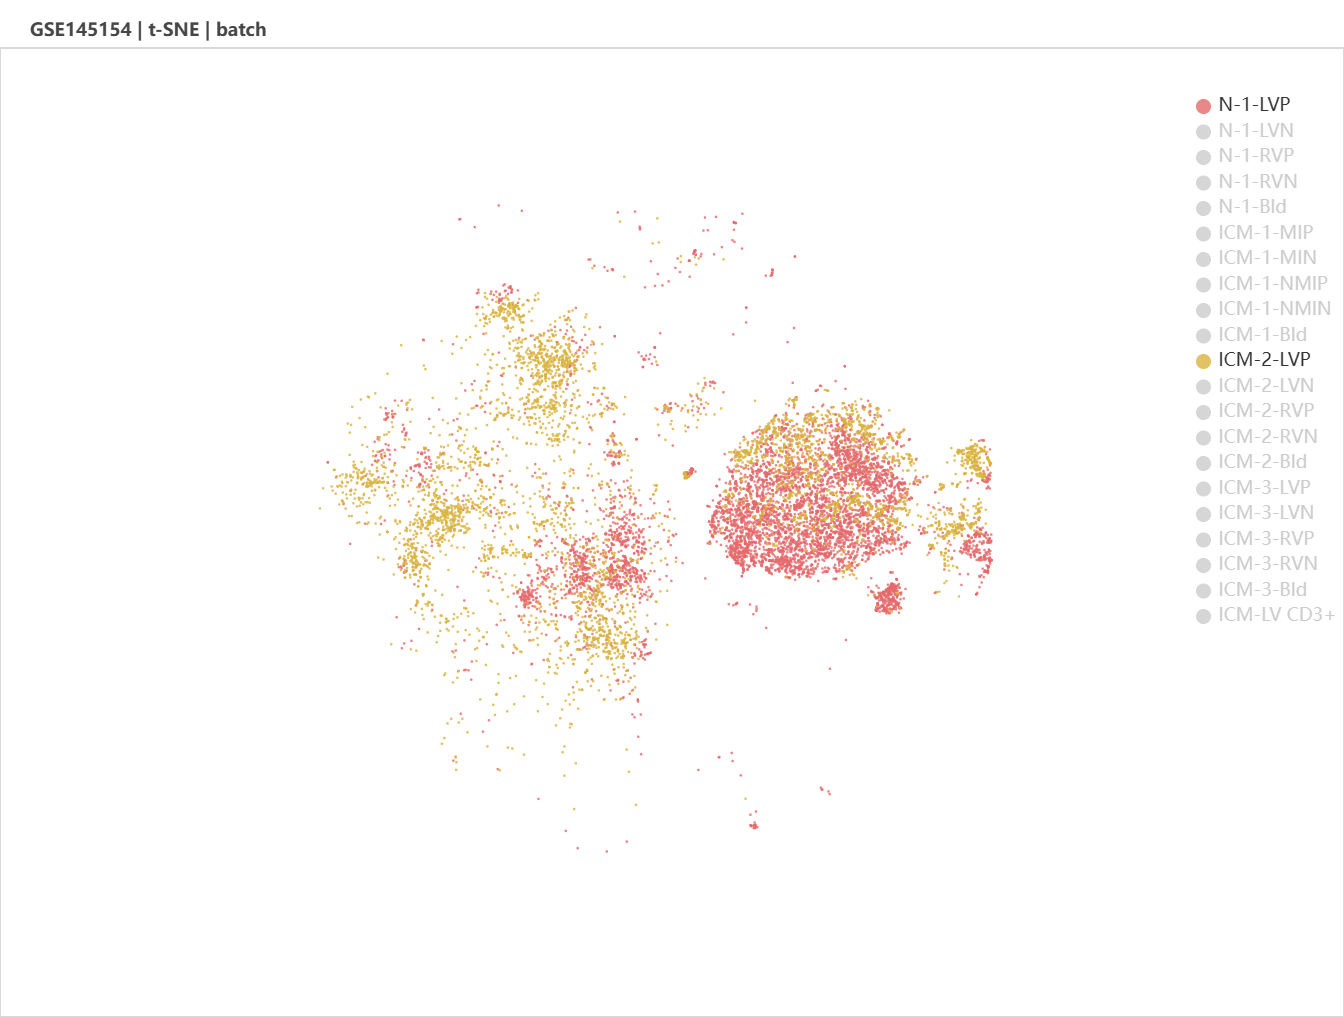
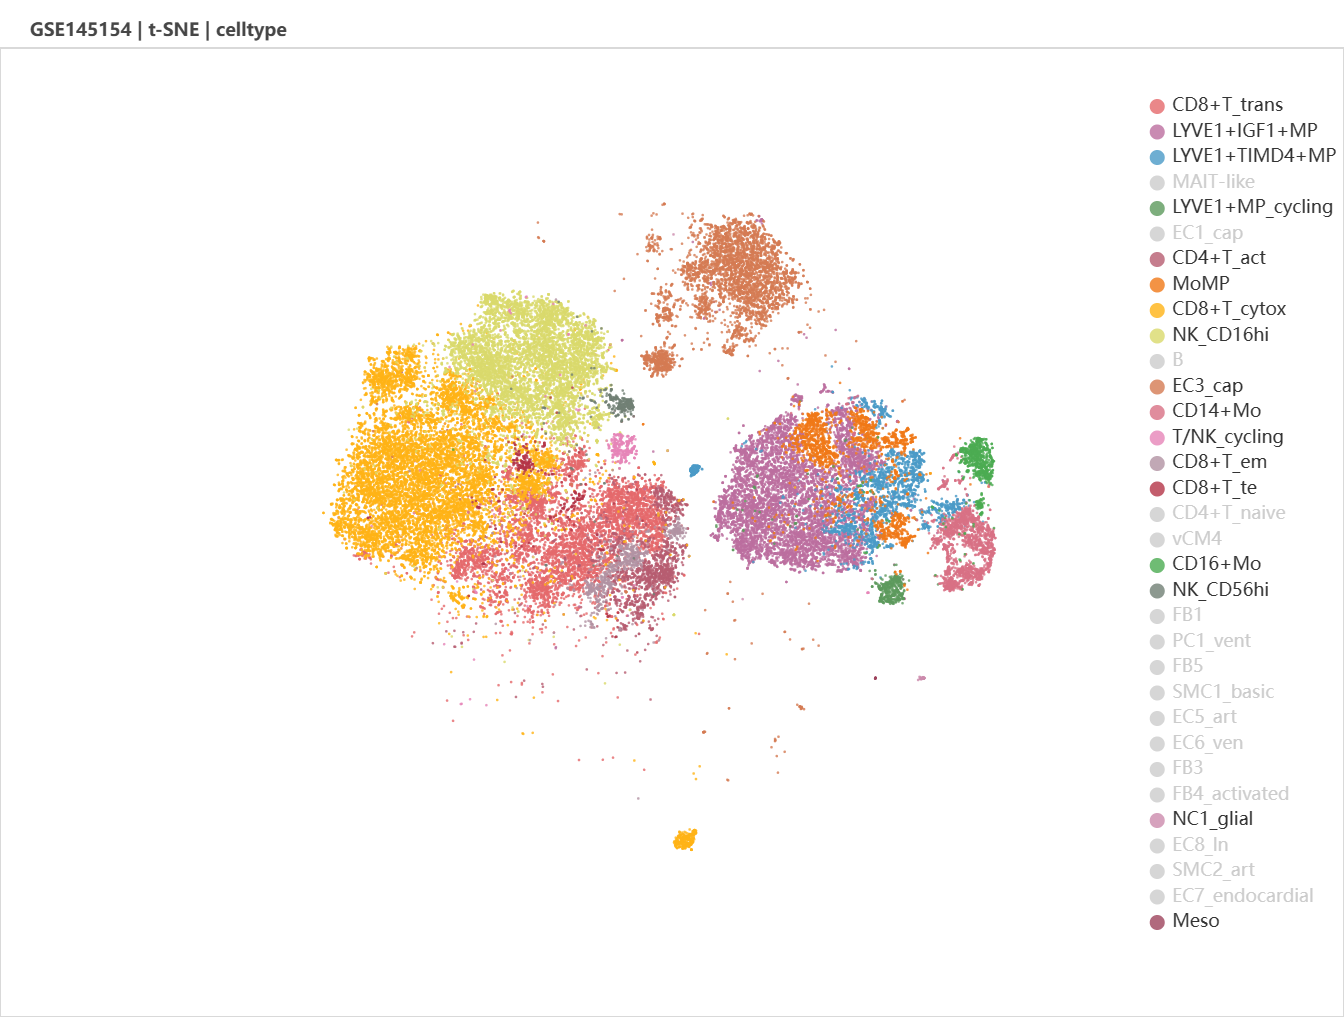
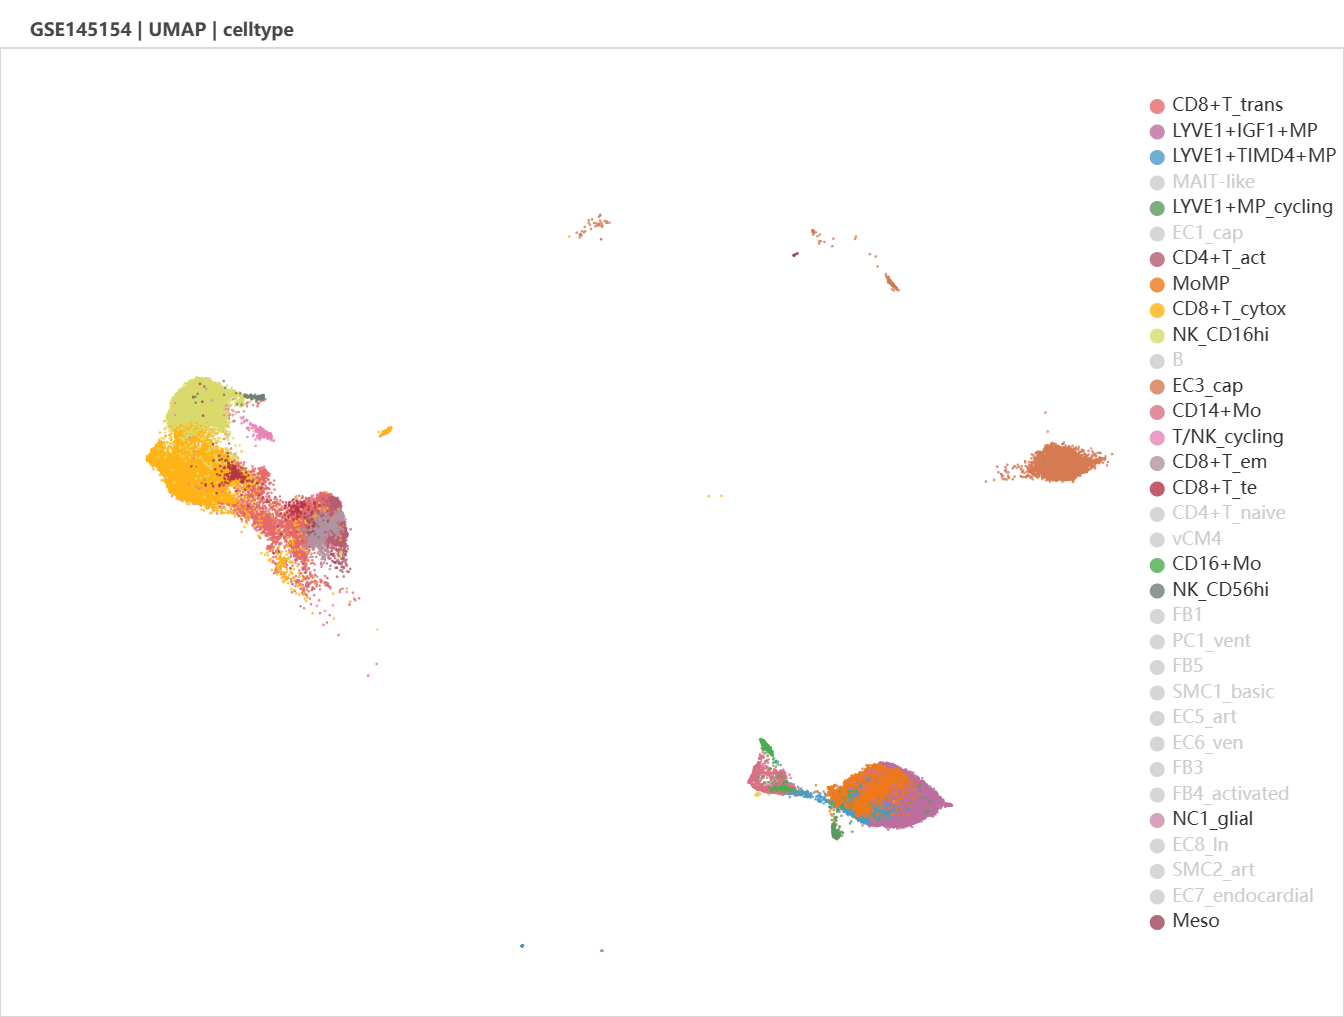
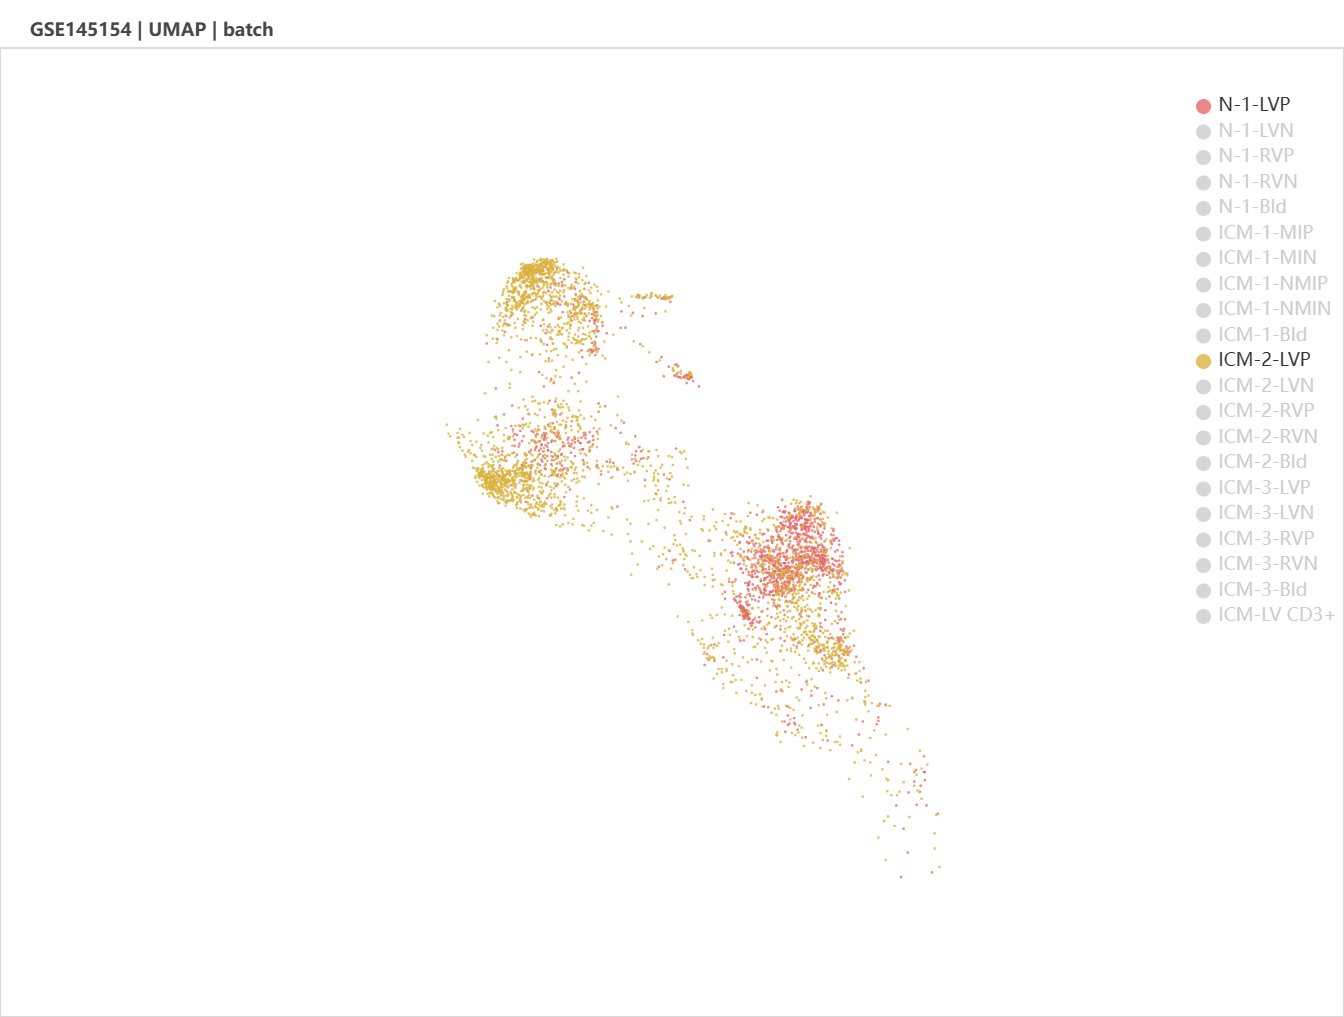
We select GSE145154 as it contains multiple infarcted and non-infarcted ventricle/blood samples from adult human, which is useful for cross-validation. Batches (left) and major cell types (right) was shown in the viewport.
We select GSE145154 as it contains multiple infarcted and non-infarcted ventricle/blood samples from adult human, which is useful for cross-validation. Batches (left) and major cell types (right) was shown in the viewport.

Let's compare the cell type composition between an infarcted and a non-infarcted sample. Click the legends to shut down unnecesssary samples and cell types.
It might be unclear by just examine the t-SNE plot. UMAP and diffusion plot is optional. Let's try UMAP.
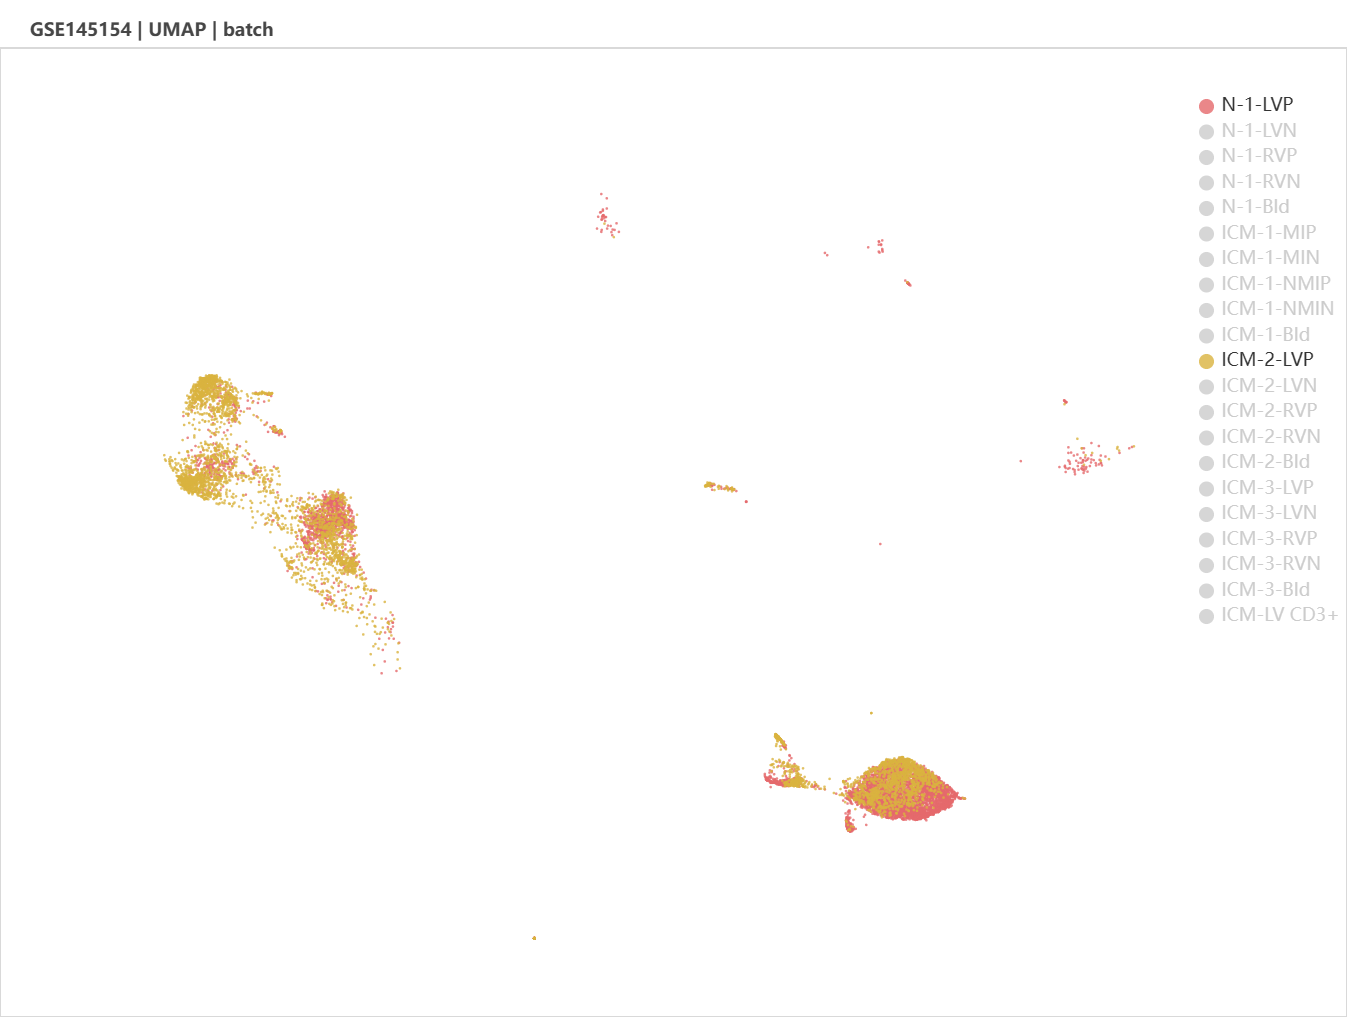
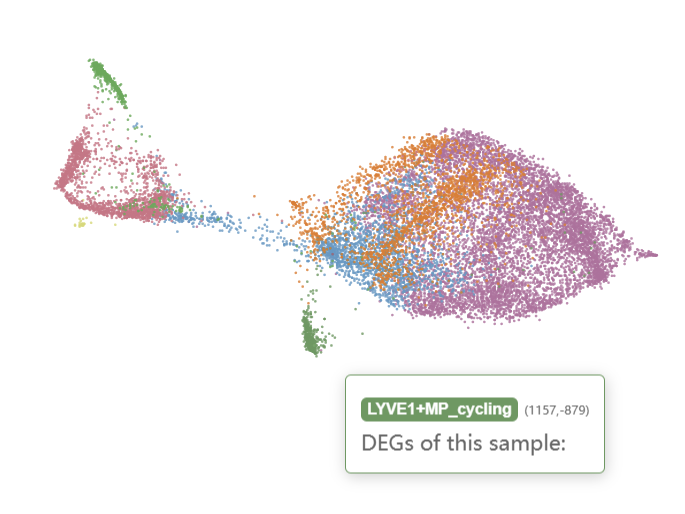
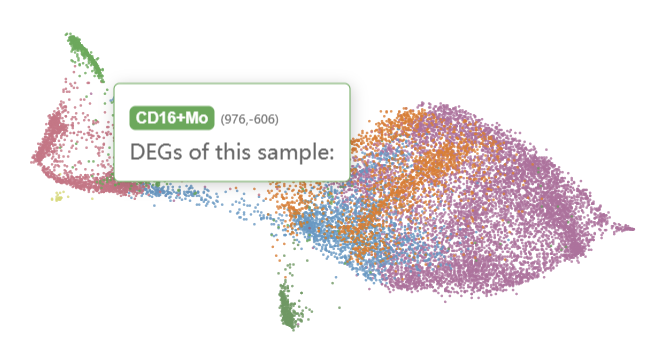
We can see that the ICM-2-LVP contains more cells belongs to the left leukocyte clusters and the right-bottom monocyte-macrophage clusters. After zoom in, we see that CD16+ monocytes and LYVE1+ cycling macrophages were specific to infarcted tissue.
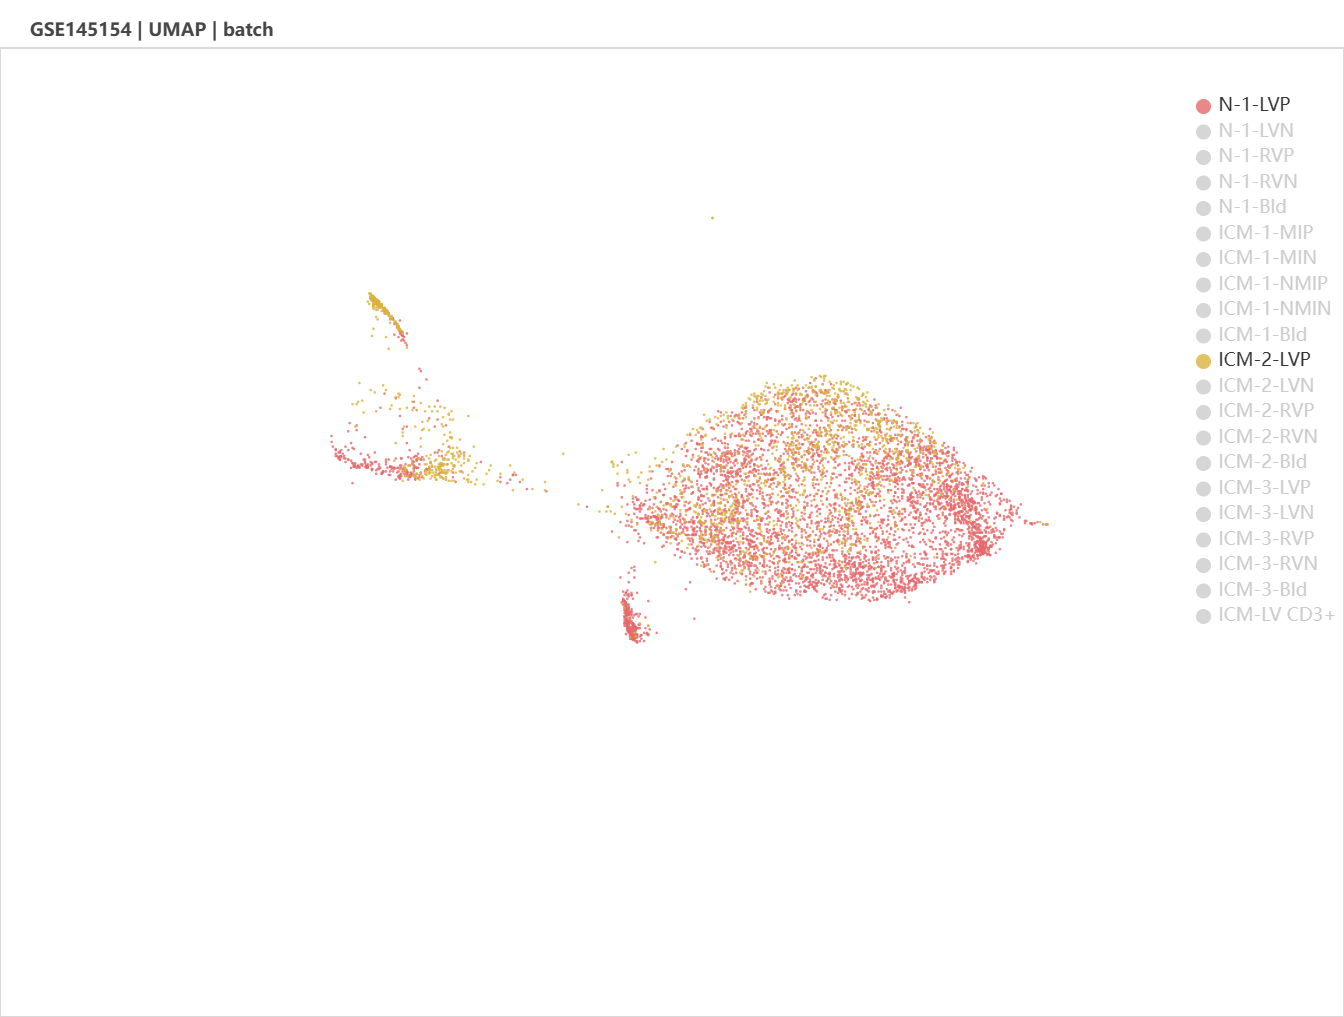
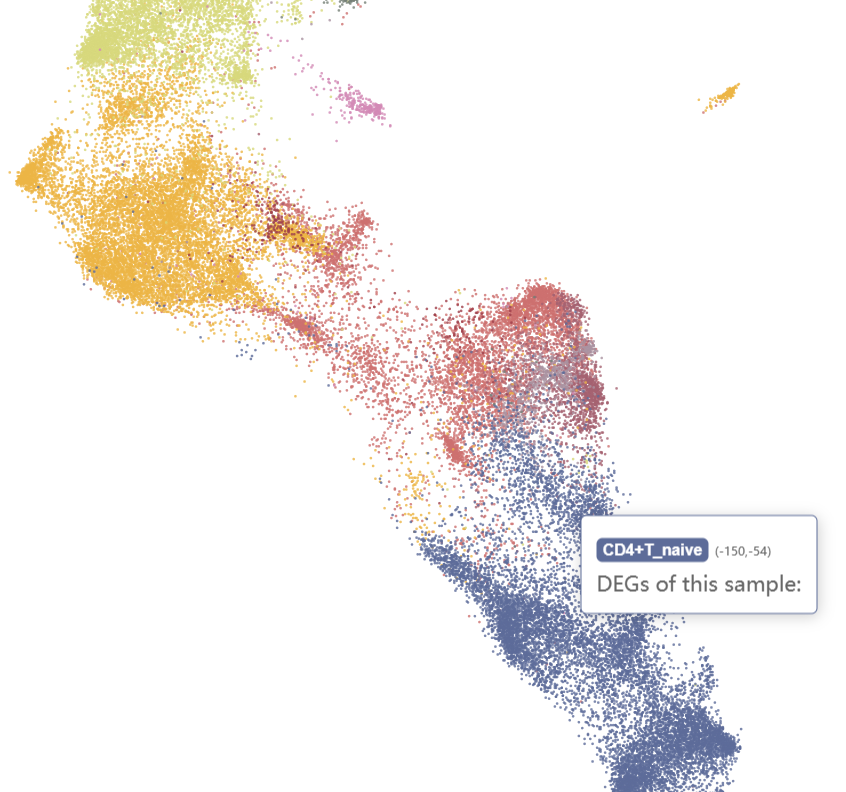
And naive CD4+ T cells, cytotoxic CD8+ T cells, CD16+ NKs, and CD56+ NKs were enriched in the ICM-2-LVP sample.
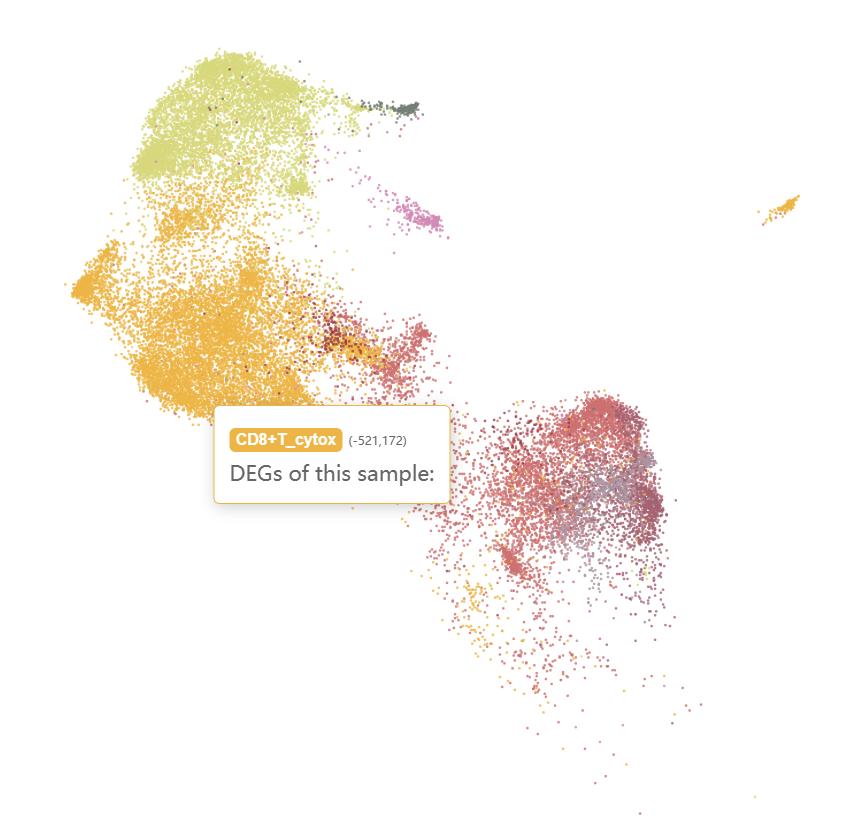
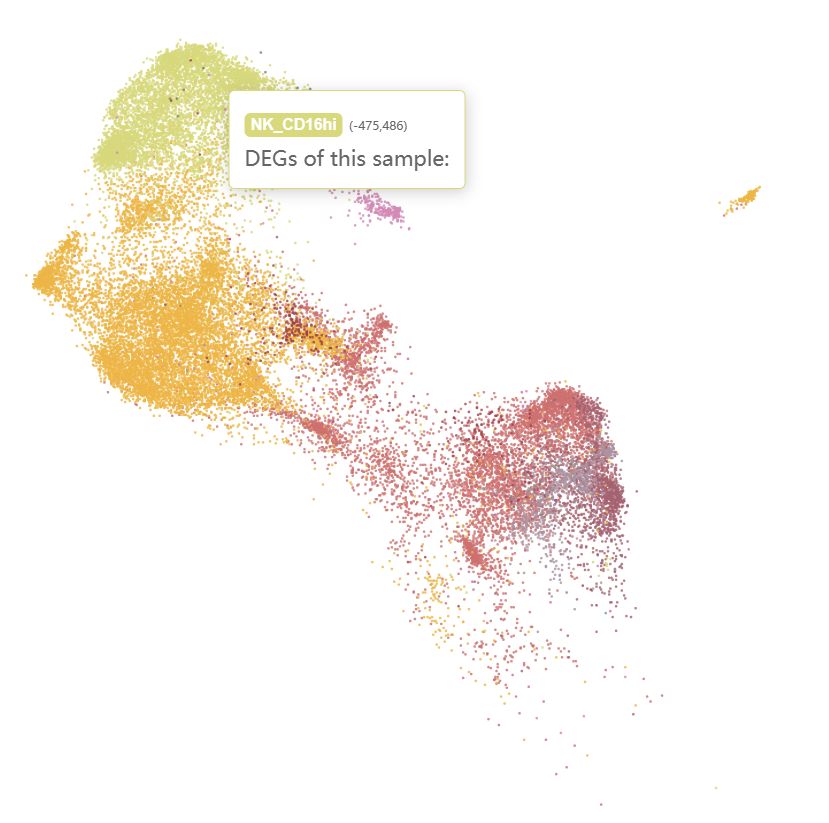
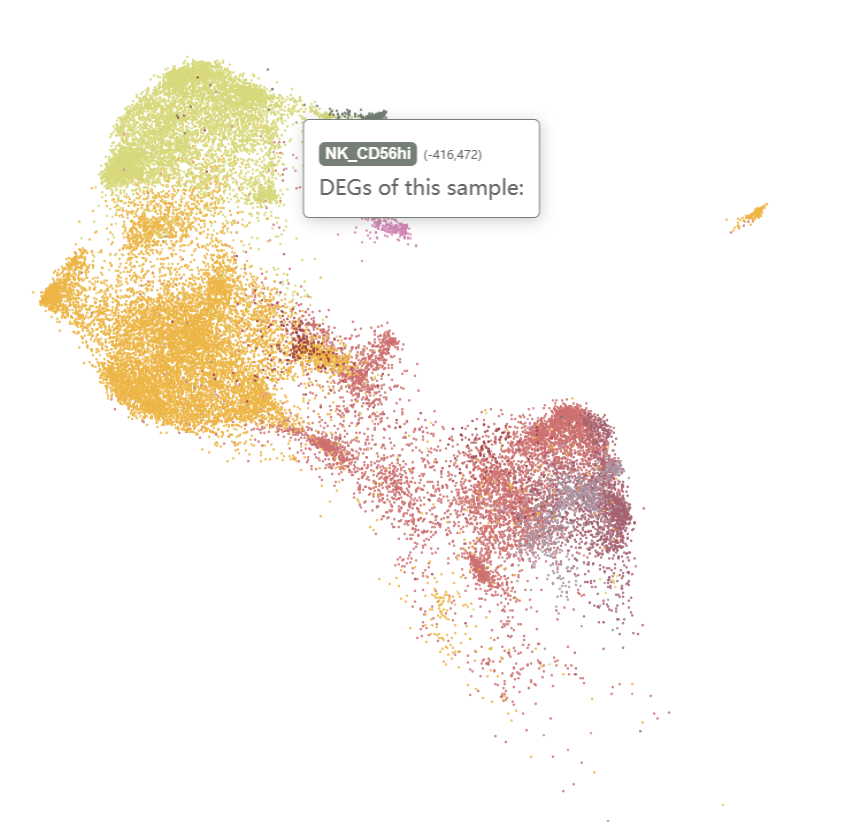
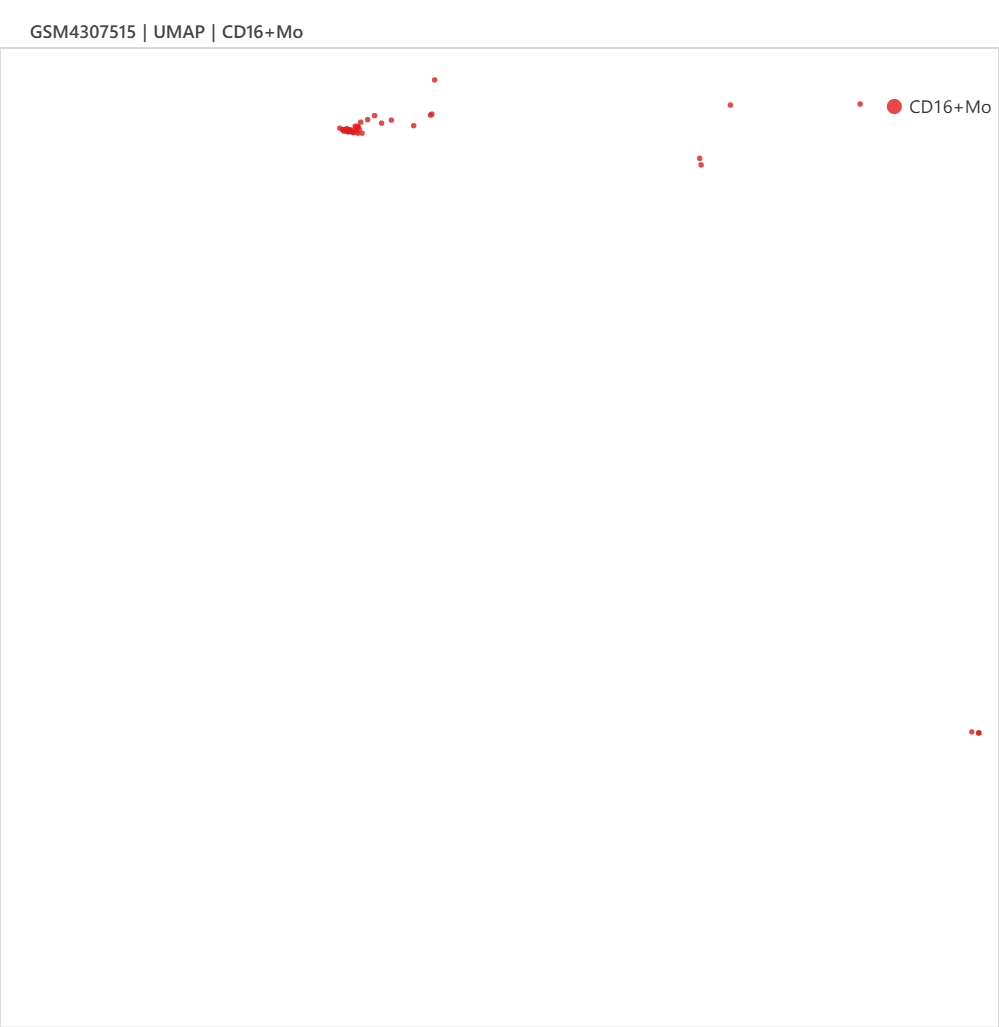
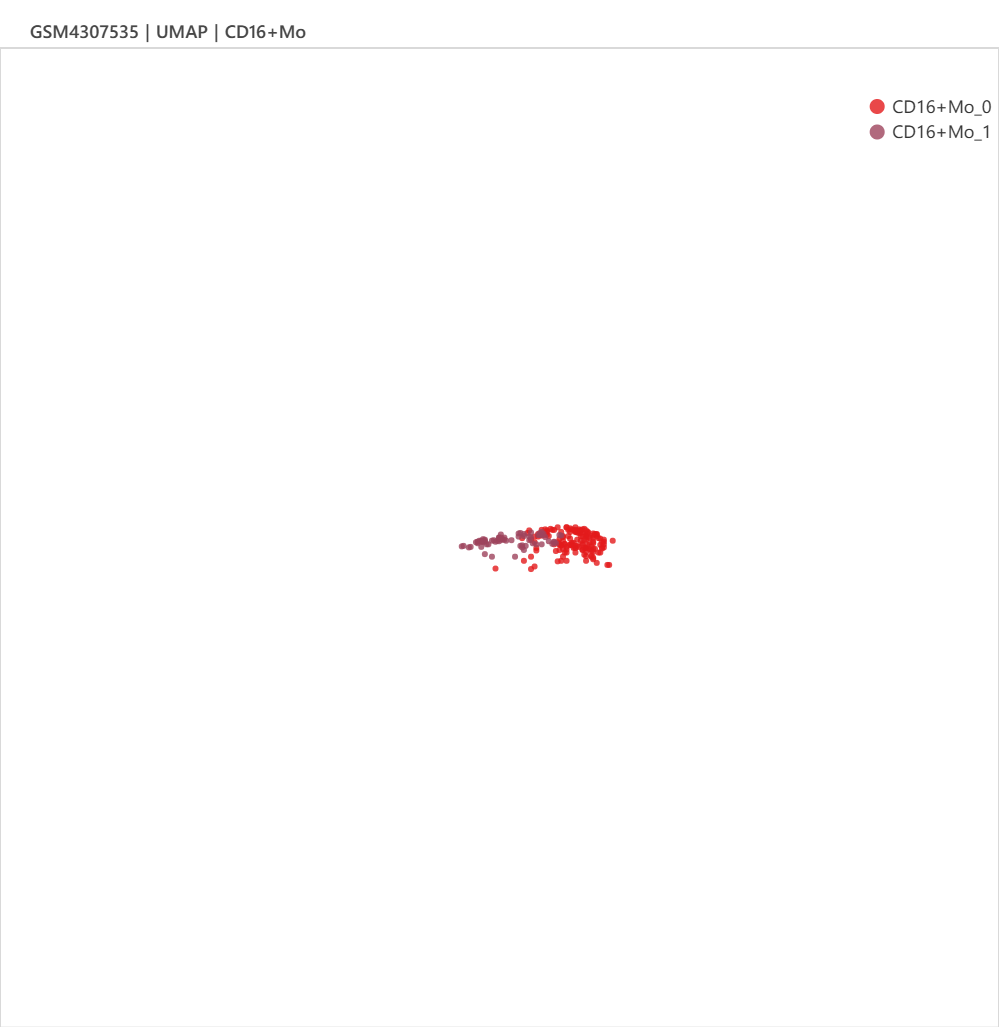
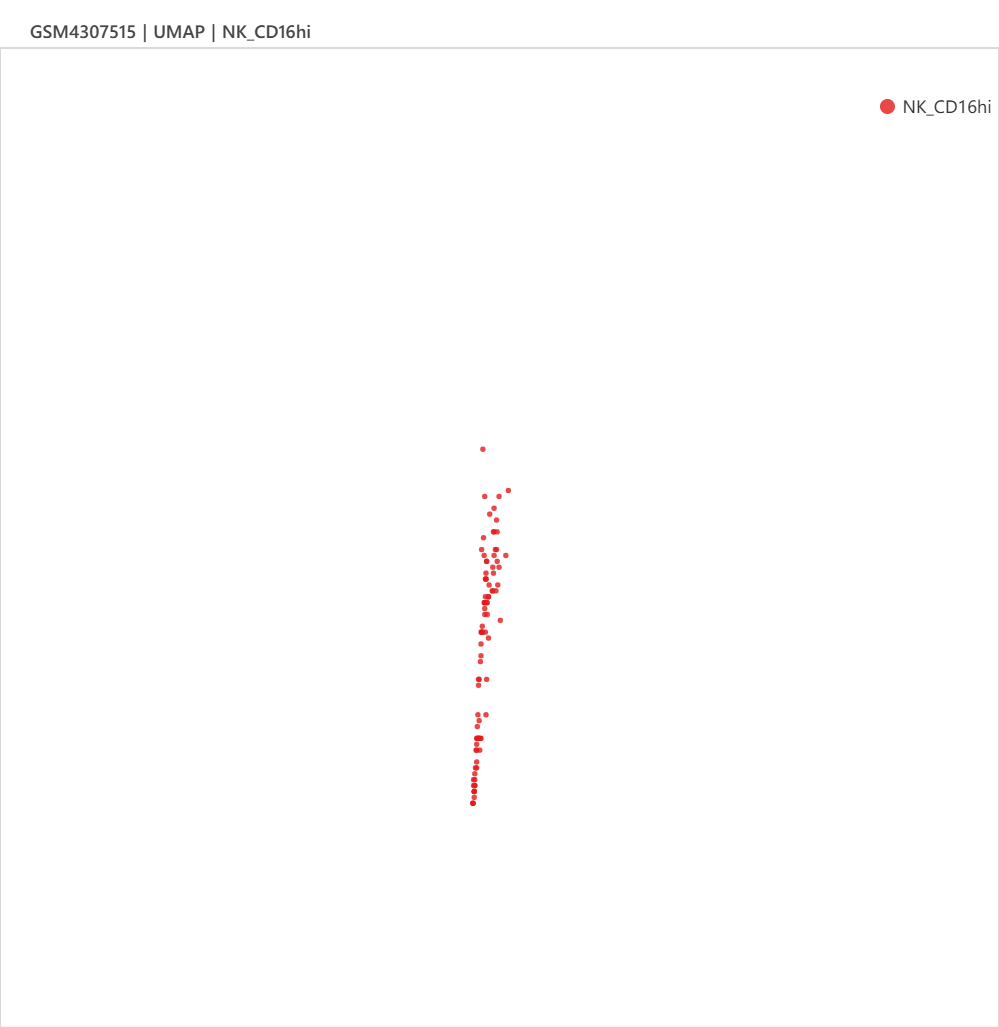
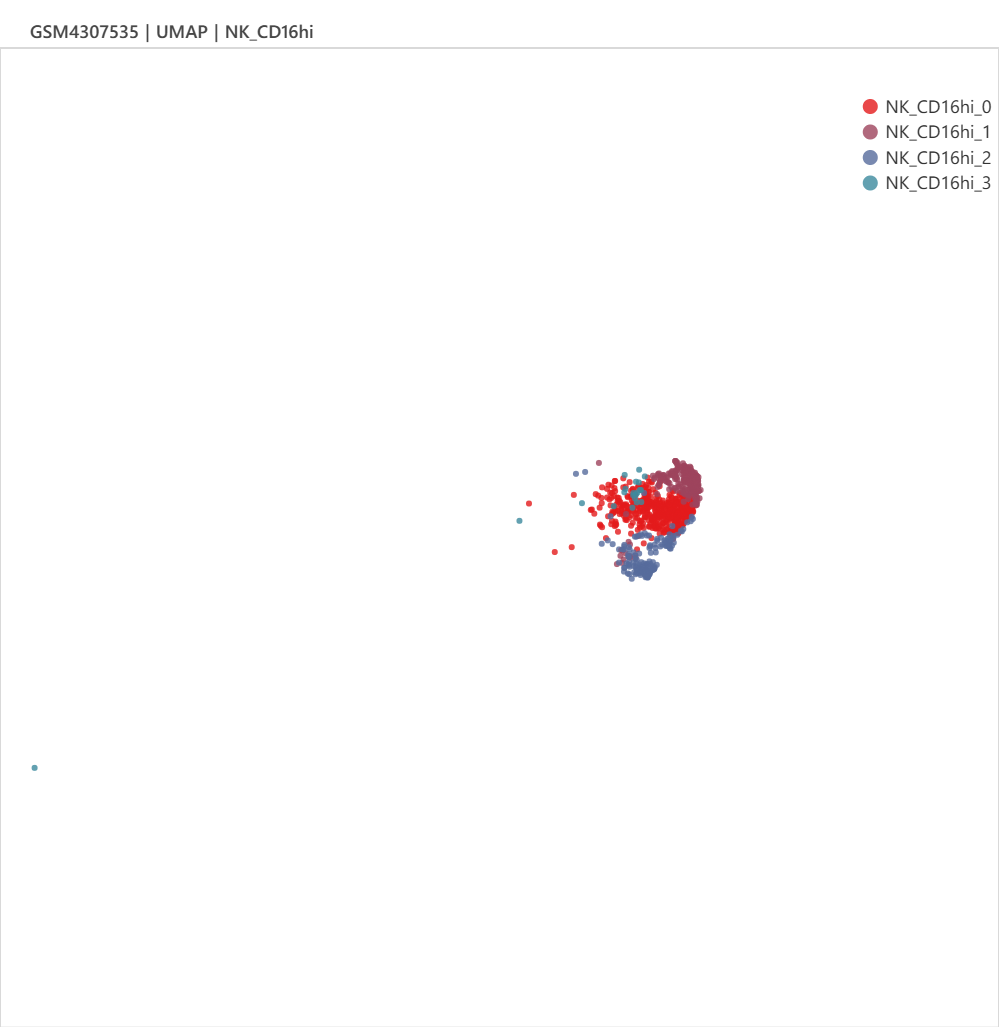
Checking the N-1-LVP (GSM4307515) and ICM-2-LVP (GSM4307535) datset respectively, we can see that the infarction sample contains more CD16+ monocytes and CD16+ NK cells, which can be clustered into more subgroups at the same resolution.